Java memory model
- Mar 7, 2021
- 7 min read
Once we launch the JVM, the operating system allocates memory for the JVM process.
Process includes the Heap, Meta Space, JIT code cache, thread stacks, and shared libraries. We call this native memory. How much memory the OS allocates to the JVM process depends on the operating system, processor, and the JRE.
Different memory blocks available for the JVM :-
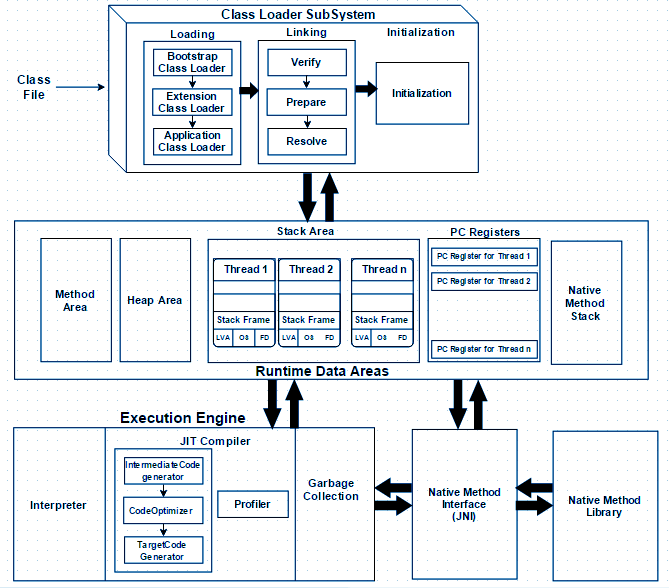
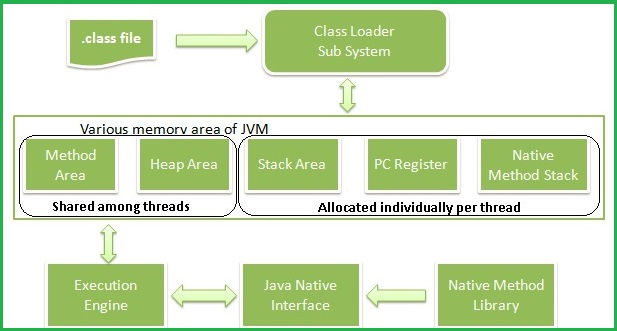
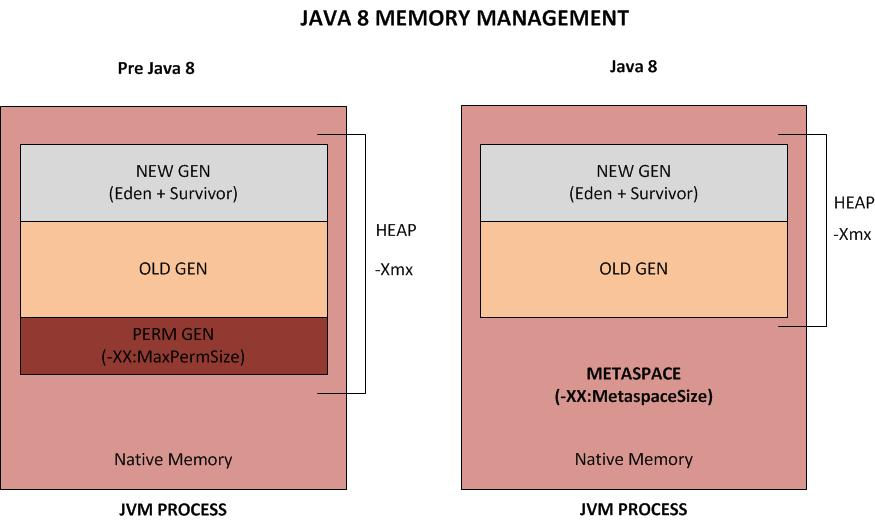
1) Method Area/Memory : It is created on VM startup. All class level information like class name, immediate parent class name, methods and variables information etc. are stored, including static variables. Up to Java 6, the constant pool and Class information are part of Perm Gen space intern part of the heap area. In Java 7, only class information is in the Perm Gen; the String literal pool is on the heap. Java 8 has no Perm Gen. The literal pools and class information are on the heap separately.
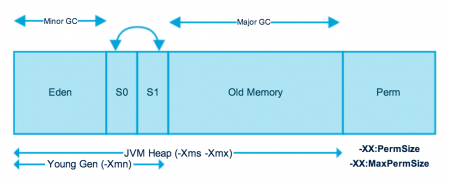
2) Heap Area/Memory: It stores all objects and the arrays. Heap data area is created at VM startup. Claiming the memory back is done automatically by the garbage collector (GC). This is one of the best feature of Java. This memory is in turn split into two different areas called the “Young/New Generation Space” and “Tenured/Old Generation Space“.
Young/New Generation Space: It is divided into two portions called “Eden Space” and “Survivor Space".
Eden Space: When we create an object, the memory will be allocated from the Eden Space.
Survivor Space: This contains the objects that have survived from the Young garbage collection or Minor garbage collection. We have two equally divided survivor spaces called S0 and S1.
Tenured/Old Generation Space: The objects which reach to max tenured threshold during the minor GC or young GC, will be moved to “Tenured Space” or “Old Generation Space“.
3) Stack Area/Memory: For every thread, JVM create one run-time stack which is stored here. Every block of this stack is called activation record/stack frame which store methods calls. A frame contains array of local variables, Operand stack and Reference to run-time constant pool. After a thread terminate, it’s run-time stack will be destroyed by JVM.
4) PC Registers: Each thread will have separate PC Registers, to hold the address of current executing instruction once the instruction is executed the PC register will be updated with the next instruction. If the current executing method is ‘native’, then the value of program counter register will be undefined.
5) Native Method Stacks: For every thread, separate native stack is created. It stores native method information.
6) Runtime Constant Pool: It is per class/interface structure, It is runtime representation of constant_pool table generated at compile time which is stored in class file.
What is PermGen?
Short form for Permanent Generation, PermGen is the memory area in Heap that is used by the JVM to store class and method objects. If your application loads lots of classes, PermGen utilization will be high. PermGen also holds ‘interned’ Strings
The size of the PermGen space is configured by the Java command line option -XX:MaxPermSize
Typically 256 MB should be more than enough of PermGen space for most of the applications.
However, It is not unusal to see the error “java.lang.OutOfMemoryError: PermGen space“ if you are loading unusual number of classes.
Gone are the days of OutOfMemory Errors due to PermGen space. With Java 8, there is NO PermGen. That’s right. So no more OutOfMemory Errors due to PermGen.
The key difference between PermGen and Metaspace is this: while PermGen is part of Java Heap (Maximum size configured by -Xmx option), Metaspace is NOT part of Heap. Rather Metaspace is part of Native Memory (process memory) which is only limited by the Host Operating System.
So, what is the significance of this change?
While you will NOT run out of PermGen space anymore (since there is NO PermGen), you may consume excessive Native memory making the total process size large. The issue is, if your application loads lots of classes (and/or interned strings), you may actually bring down the Entire Server (not just your application). Why ? Because the native memory is only limited by the Operating System. This means you can literally take up all the memory on the Server. Not good.
It is critical that you add the new option -XX:MaxMetaspaceSize which sets the Maximum Metaspace size for your application.
Note that it is no longer sufficient to just monitor the Heap Size. You must also monitor the Metaspace which you can do by just keeping an eye on the ‘process size’ using your Operating System utilities (Example: ‘top’ in Unix/Linux, ‘Task Manager’ in Windows).
You can use the jmap command to print out Memory statistics of your current pre Java 8 application.
jmap -permstat <PID>
Garbage Collection: (Minor GC and Major GC)
The young generation is the place where all the new objects are created. When the young generation is filled, garbage collection is performed. This garbage collection is called Minor GC.
Most of the newly created objects are located in the Eden memory space. When Eden space is filled with objects, Minor GC is performed and all the survivor objects are moved to one of the survivor spaces.
Minor GC also checks the survivor objects and move them to the other survivor space. So at a time, one of the survivor space is always empty.
Objects that are survived after many cycles of GC, are moved to the Old generation memory space. Usually, it’s done by setting a threshold for the age of the young generation objects before they become eligible to promote to Old generation.
Old Generation memory contains the objects that are long-lived and survived after many rounds of Minor GC. Usually, garbage collection is performed in Old Generation memory when it’s full. Old Generation Garbage Collection is called Major GC and usually takes a longer time.
Stop the World Event
All the Garbage Collections are “Stop the World” events because all application threads are stopped until the operation completes.
Since Young generation keeps short-lived objects, Minor GC is very fast and the application doesn’t get affected by this.
However, Major GC takes a long time because it checks all the live objects. Major GC should be minimized because it will make your application unresponsive for the garbage collection duration. So if you have a responsive application and there are a lot of Major Garbage Collection happening, you will notice timeout errors.
The duration taken by garbage collector depends on the strategy used for garbage collection. That’s why it’s necessary to monitor and tune the garbage collector to avoid timeouts in the highly responsive applications.
Perm Gen objects are garbage collected in a full garbage collection (Major GC).
Q1) Are there any disadvantages of Garbage Collection?
Yes. Whenever the garbage collector runs, it has an effect on the application’s performance. This is because all other threads in the application have to be stopped to allow the garbage collector thread to effectively do its work.
Depending on the requirements of the application, this can be a real problem that is unacceptable by the client. However, this problem can be greatly reduced or even eliminated through skilful optimization and garbage collector tuning and using different GC algorithms.
Q2) What is the difference between Runtime.exit() and Runtime.halt()?
Runtime.exit() invokes the shutdown sequence of the underlying JVM whereas Runtime.halt() forcibly terminates the JVM process. So, Runtime.exit() causes the registered shutdown hooks to be executed and then also lets all the uninvoked finalizers to be executed before the JVM process shuts down whereas Runtime.halt() simply terminates the JVM process immediately and abruptly.
Q3) What is the meaning of the term “stop-the-world”?
When the garbage collector thread is running, other threads are stopped, meaning the application is stopped momentarily. This is analogous to house cleaning or fumigation where occupants are denied access until the process is complete.
Depending on the needs of an application, “stop the world” garbage collection can cause an unacceptable freeze. This is why it is important to do garbage collector tuning and JVM optimization so that the freeze encountered is at least acceptable.
Q4) Can I import same package/class twice? Will the JVM load the package twice at runtime?
One can import the same package or same class multiple times. Neither compiler nor JVM complains about it. But the JVM will internally load the class only once no matter how many times you import the same class.
Q5) Difference between Heap and Stack Memory?
Heap memory is used by all the parts of the application whereas stack memory is used only by one thread of execution.
Whenever an object is created, it’s always stored in the Heap space and stack memory contains the reference to it. Stack memory only contains local primitive variables and reference variables to objects in heap space.
Objects stored in the heap are globally accessible whereas stack memory can’t be accessed by other threads.
Memory management in stack is done in LIFO manner whereas it’s more complex in Heap memory because it’s used globally. Heap memory is divided into Young-Generation, Old-Generation etc.
Stack memory is short-lived whereas heap memory lives from the start till the end of application execution.
We can use -Xms and -Xmx JVM option to define the startup size and maximum size of heap memory. We can use -Xss to define the stack memory size.
When stack memory is full, Java runtime throws java.lang.StackOverFlowError whereas if heap memory is full, it throws java.lang.OutOfMemoryError: Java Heap Space error.
Stack memory size is very less when compared to Heap memory. Because of simplicity in memory allocation (LIFO), stack memory is very fast when compared to heap memory.
Q6) What is resurrection (in garbage collection)?
An object that has been eligible for garbage collection may stop being eligible and return to normal life. Within a finalize() method, you can assign this to a reference variable and prevent that object’s collection, an act many developers call resurrection.
The finalize() method is never called more than once by the JVM for any given object. The JVM will not invoke finalize() method again after resurrection (as the finalize() method already ran for that object). For example,
class Obj {
  protected void finalize(){
    System.out.println("finalize invoked");
    System.out.println("resurrect this object");
    Program.objRef = this; //resurrection
  }
}

public class Program {
  static Obj objRef = null;
  public static void main(String args[]) {
    objRef = new Obj();
    for(int i=0;i<2;i++){
      method(i);
      System.out.println("objRef = " + objRef);
    }
  }
  static void method(int i) {
    System.out.println("Round :"+(i+1));
    objRef = null;
    System.out.println("Set objRef to " + objRef);
    System.gc();//suggest to run the gc
  }
}
The output is
Round :1
Set objRef to null
objRef = null
Round :2
Set objRef to null
finalize invoked
resurrect this object
objRef = null
Developers typically use resurrection to maintain a pool of commonly used objects. However, resurrection can obscure source code and confuse what that code tries to accomplish.
Q7) Why Java is Secured Language?
Bytecode verifier (inside class-loader subsystem) is one of the feature which makes java a secured language. If attackers changes the class file manually to create some kind of virus, Bytecode verifier will detect that class file as it is not generated by valid compiler. Verfication fails, we will get runtime exception saying java.lang.VerifyError


Comments